These show in different ways how large amounts of data can be visualised to make it easier to understand certain aspects of the data, that be the sheer amount, number of different markers and so on.
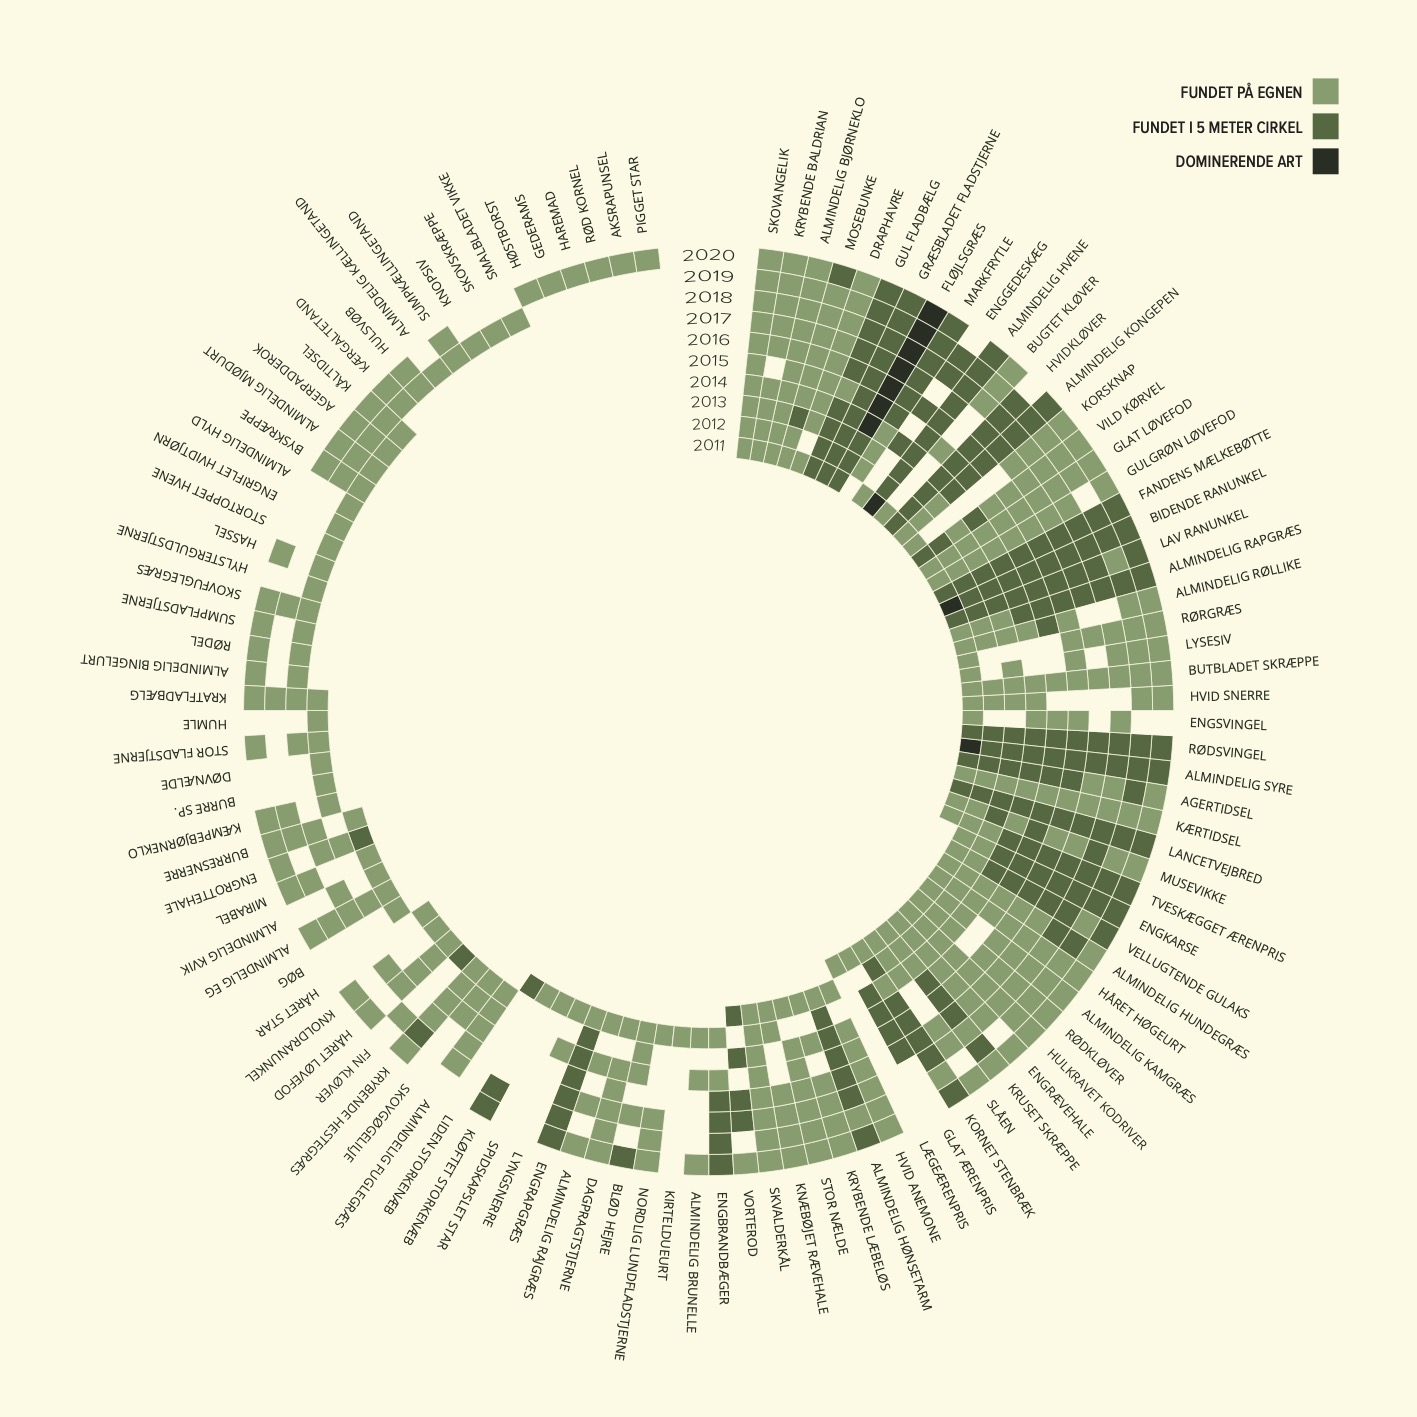
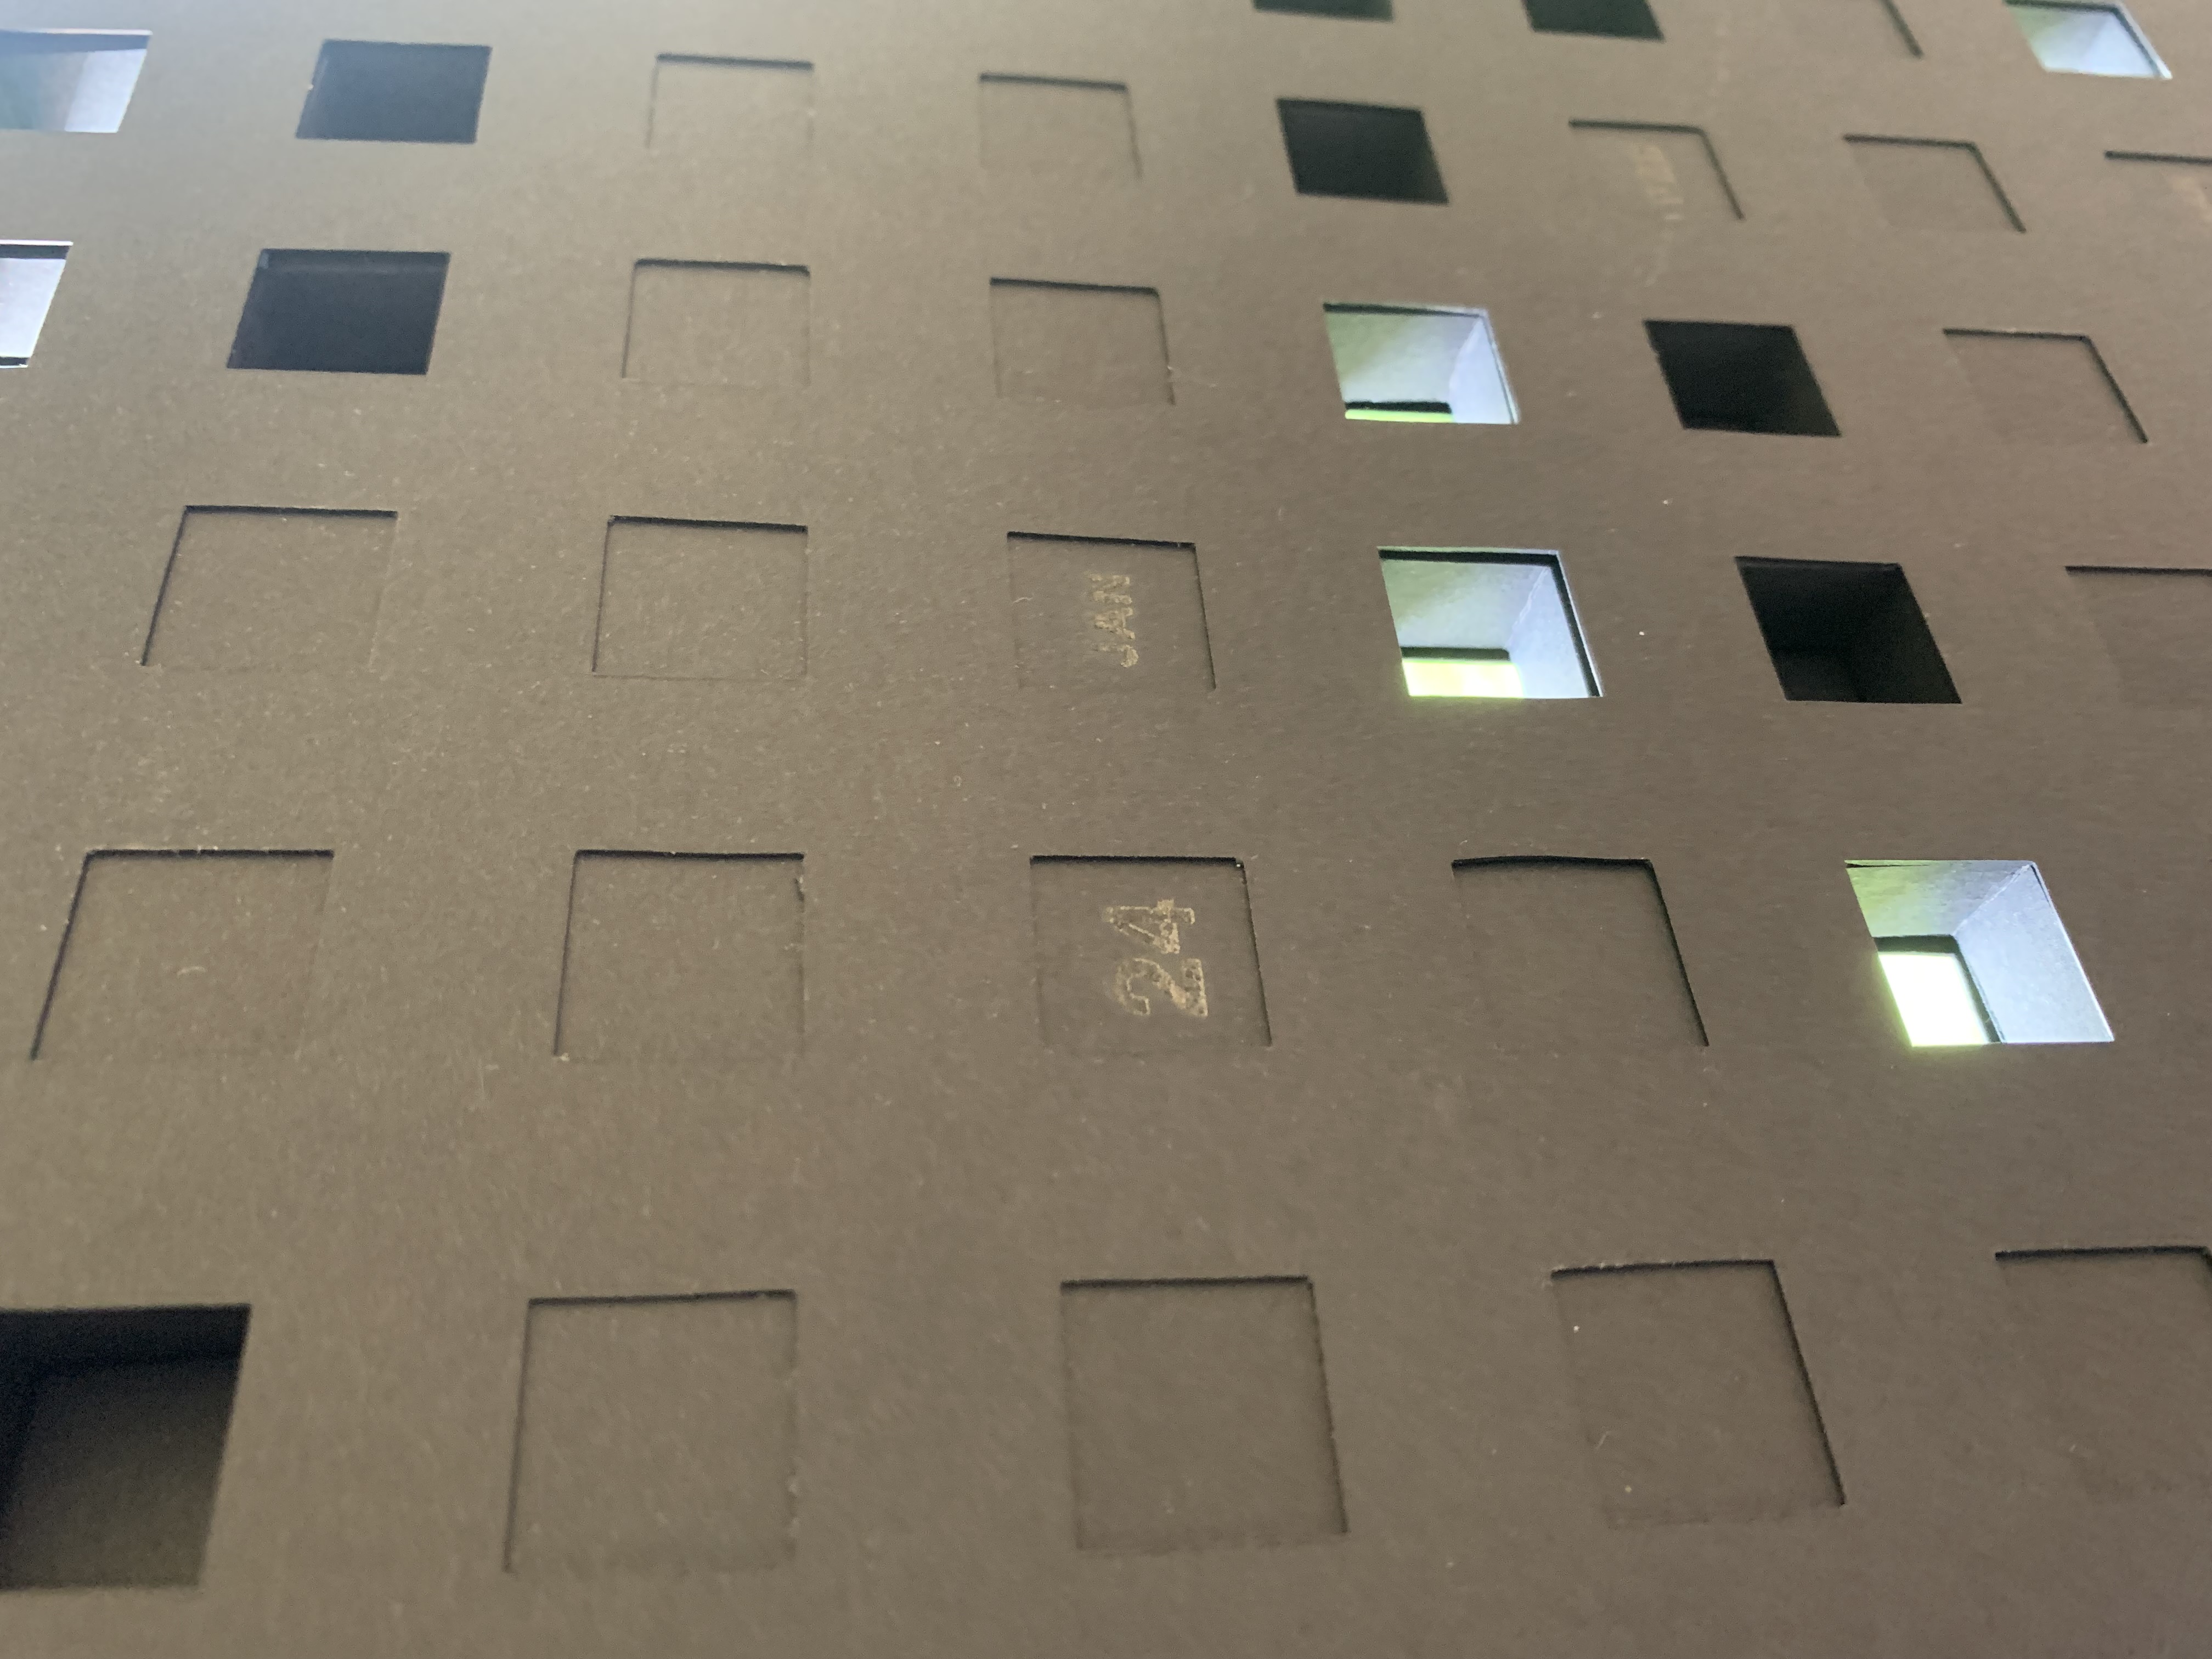
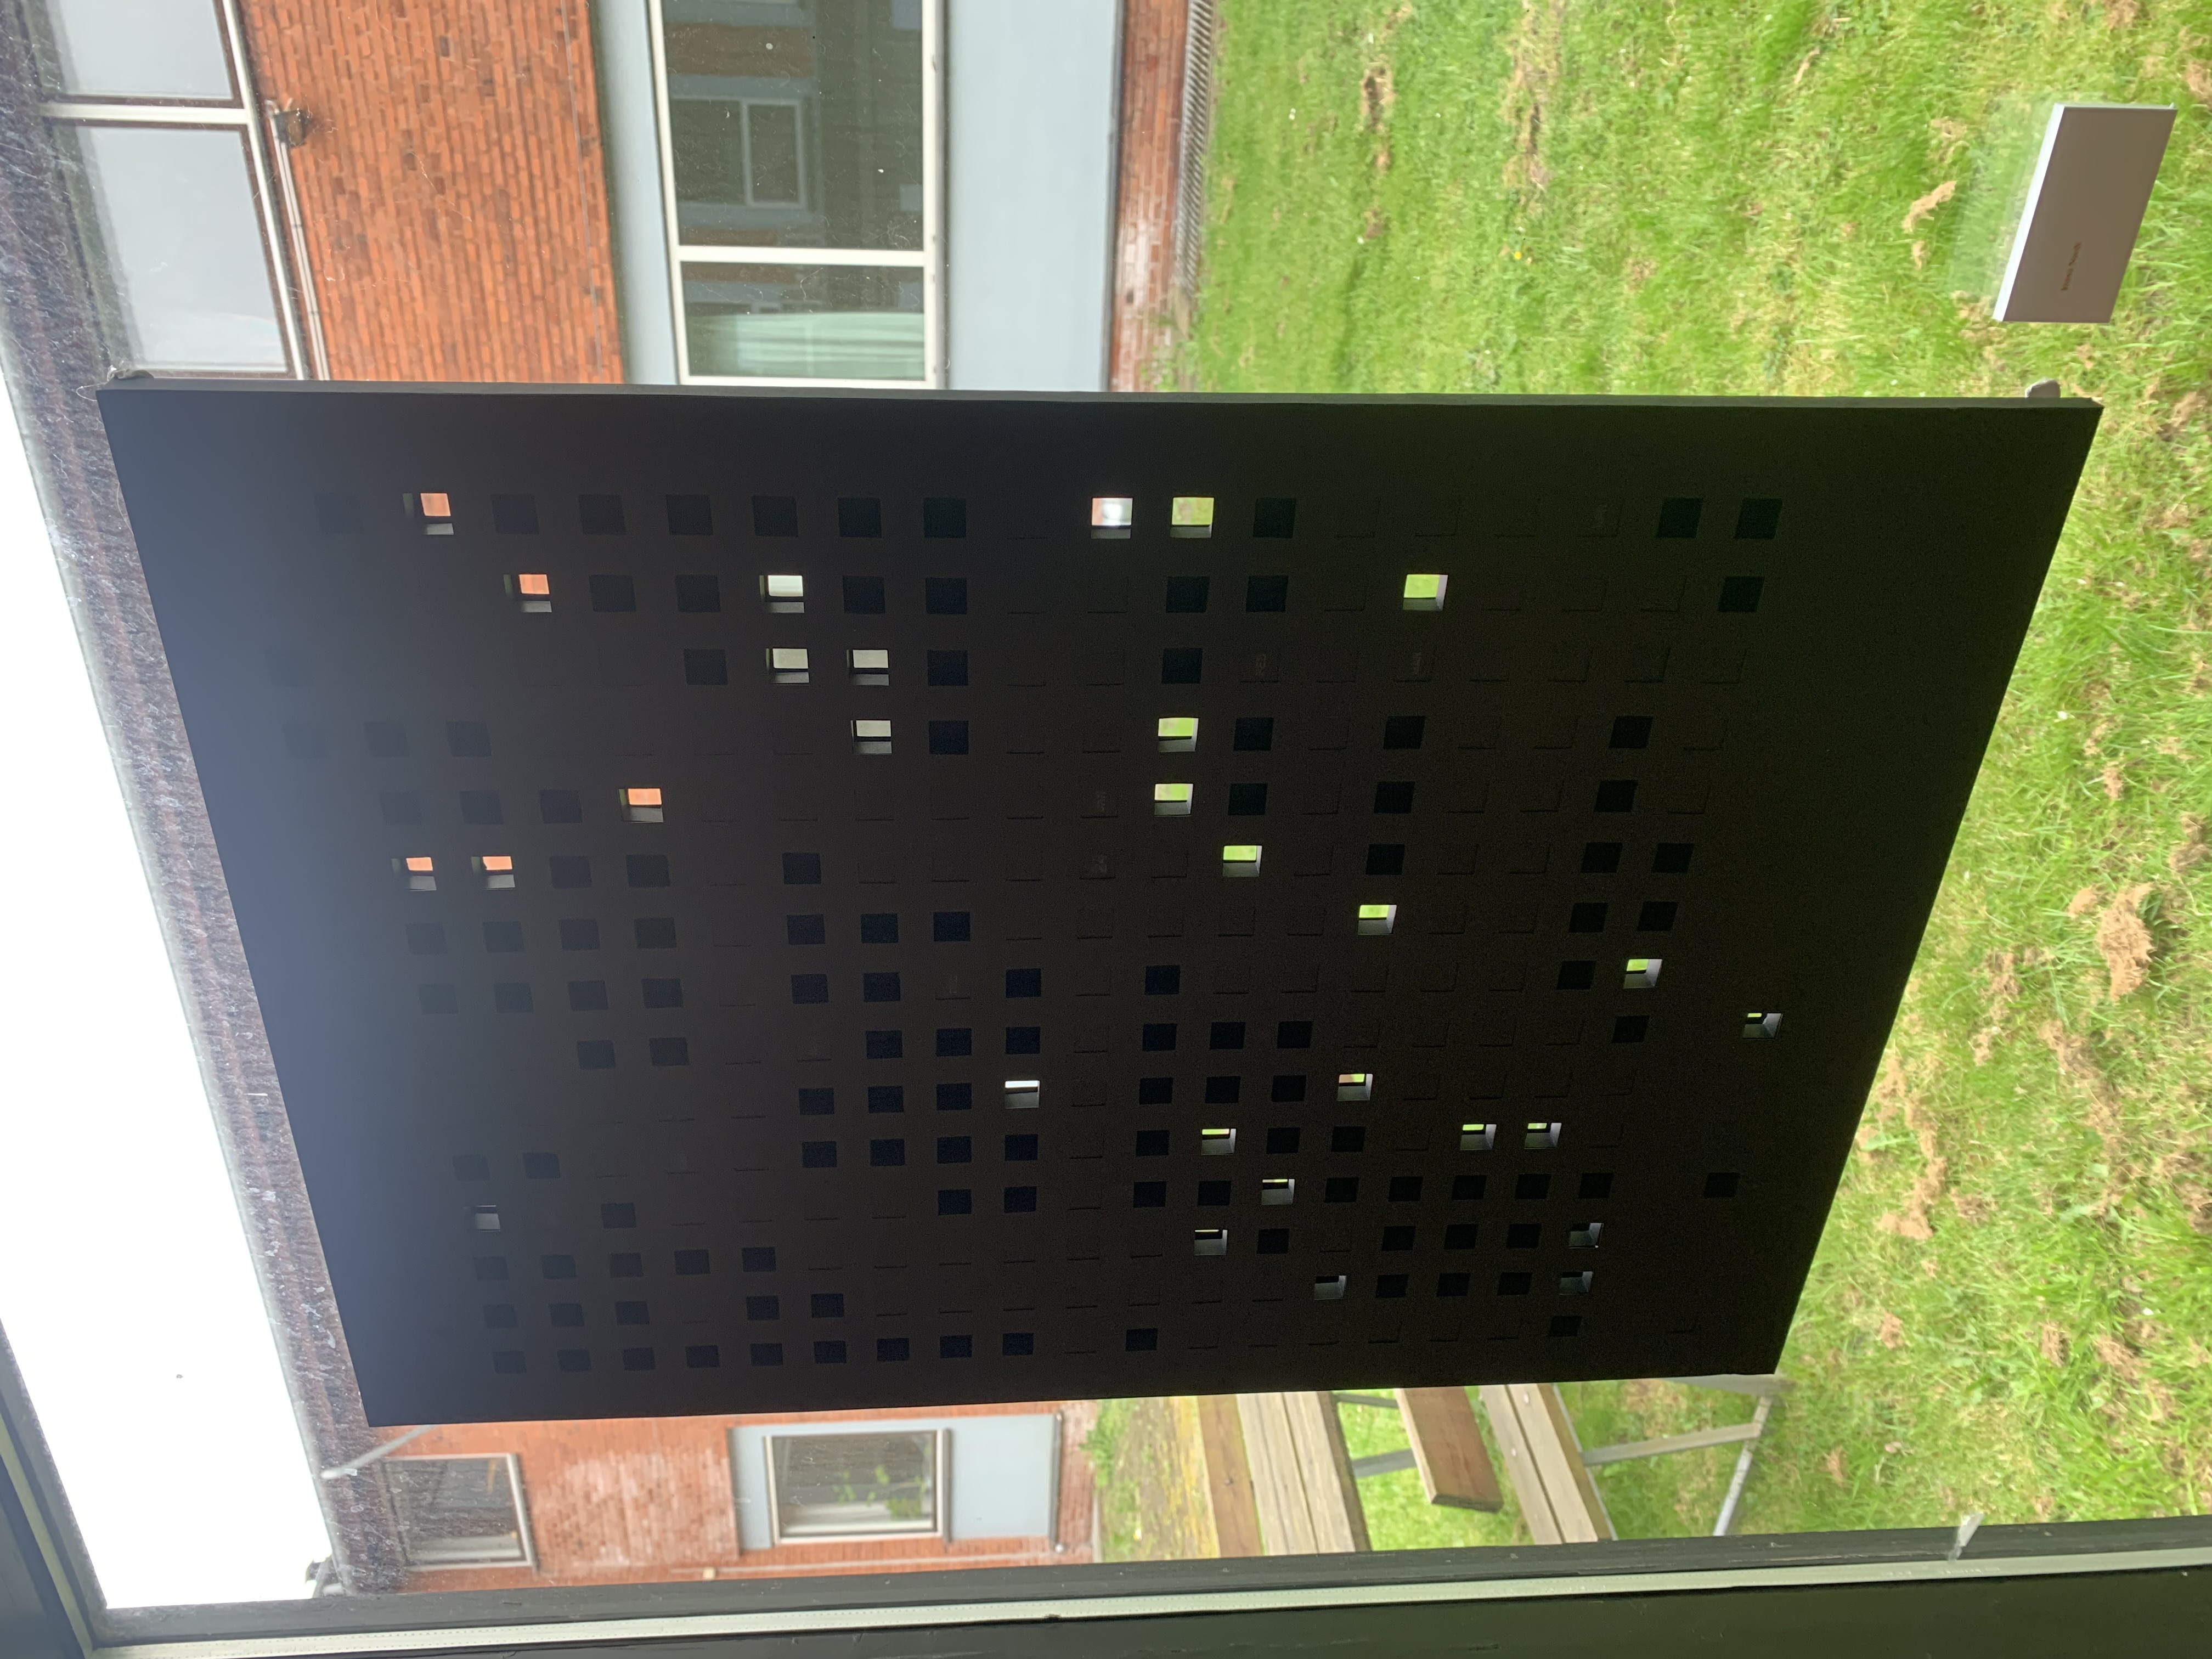
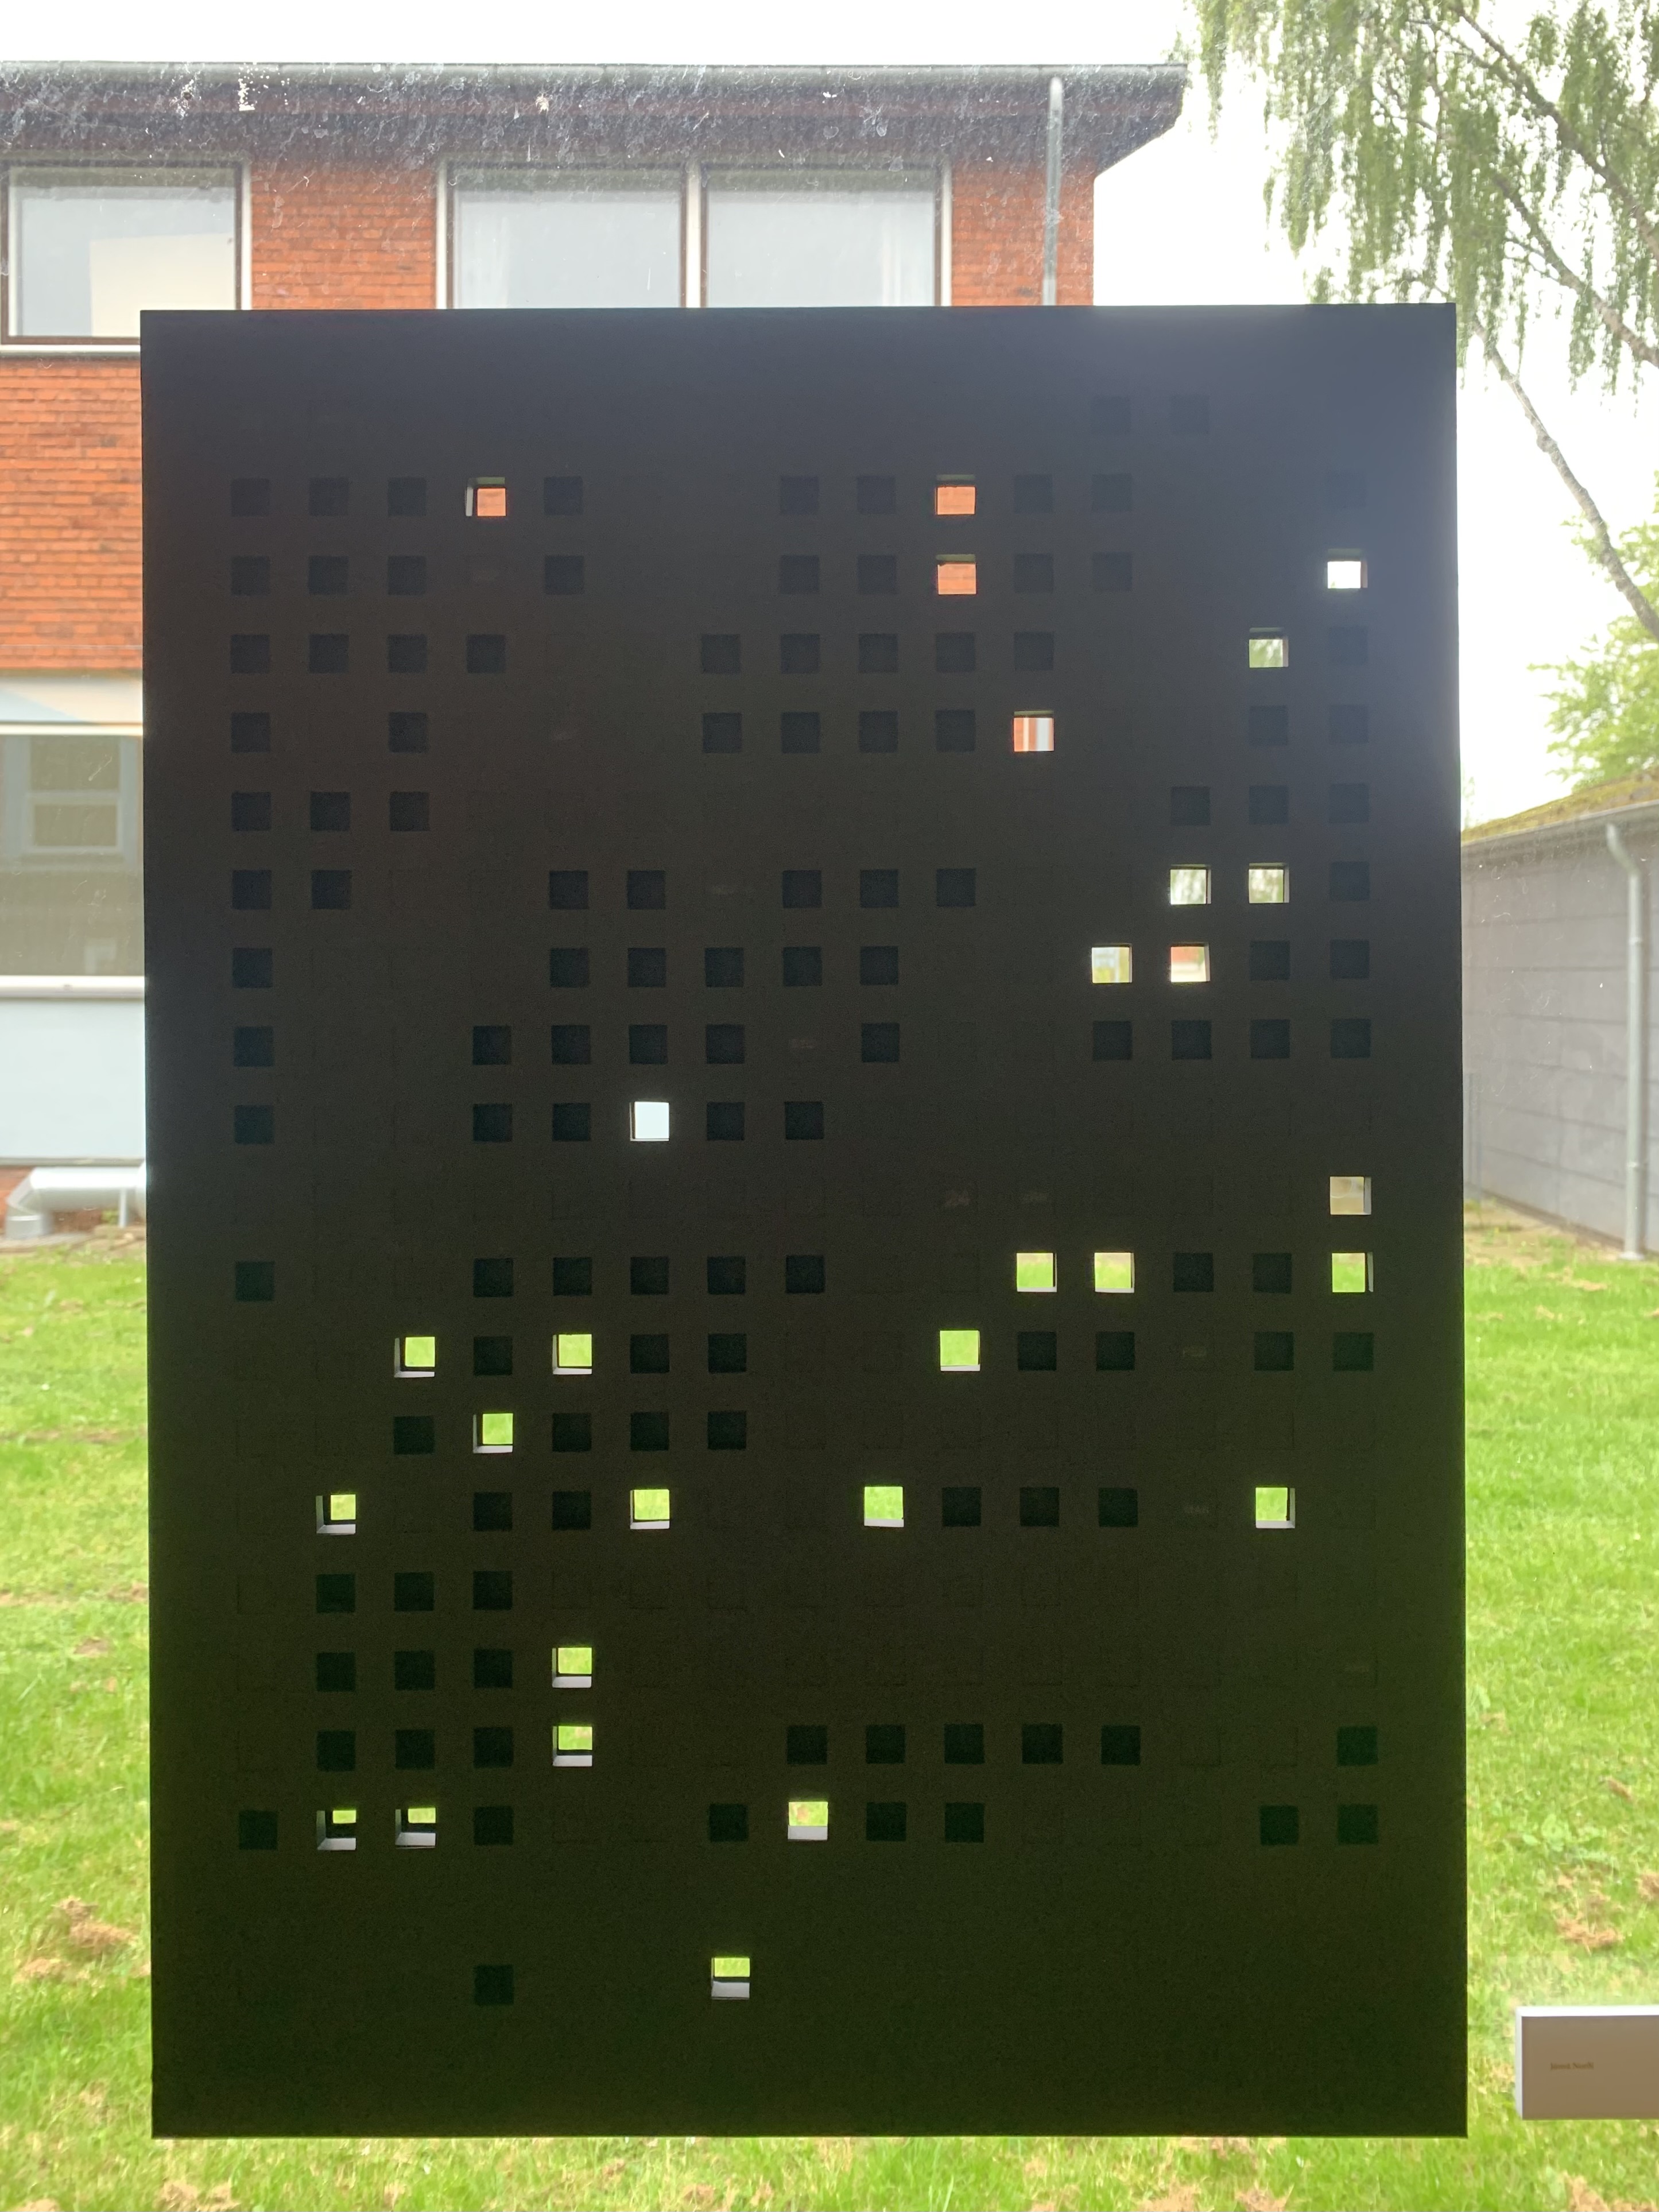

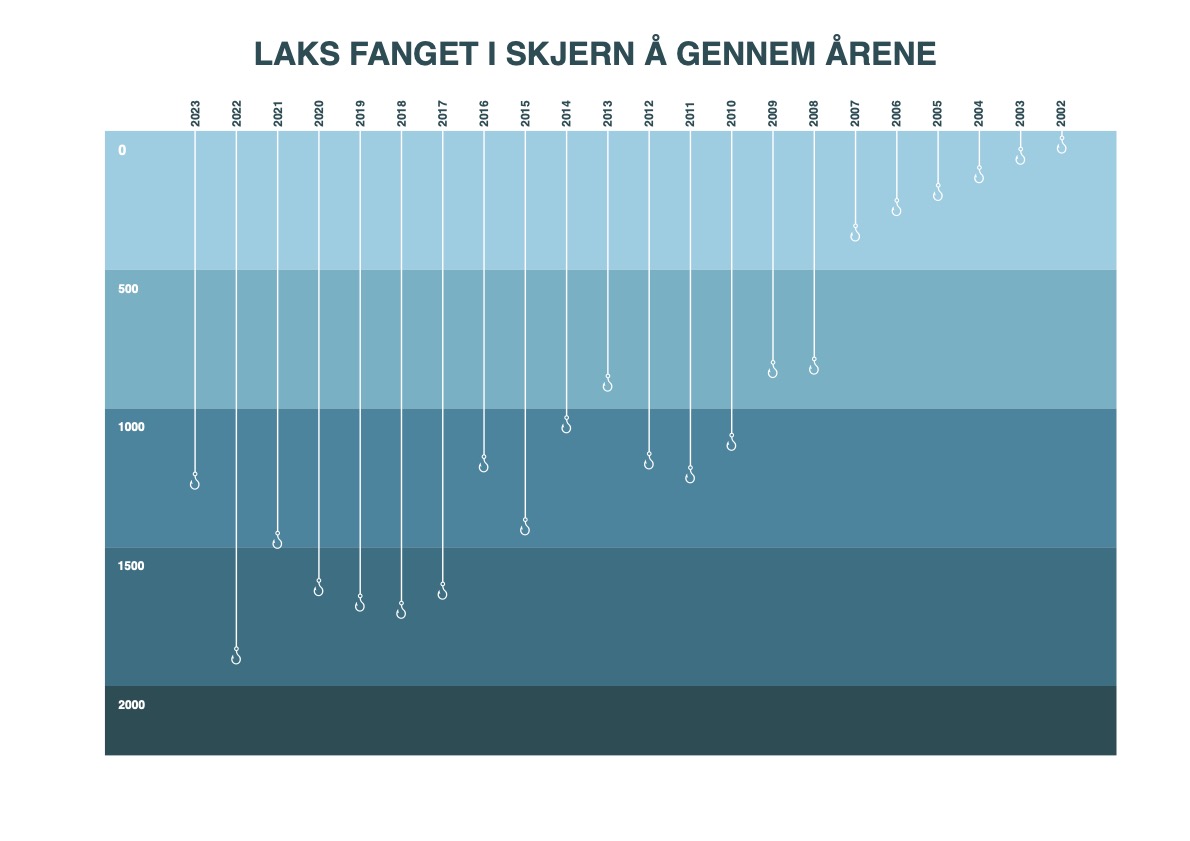
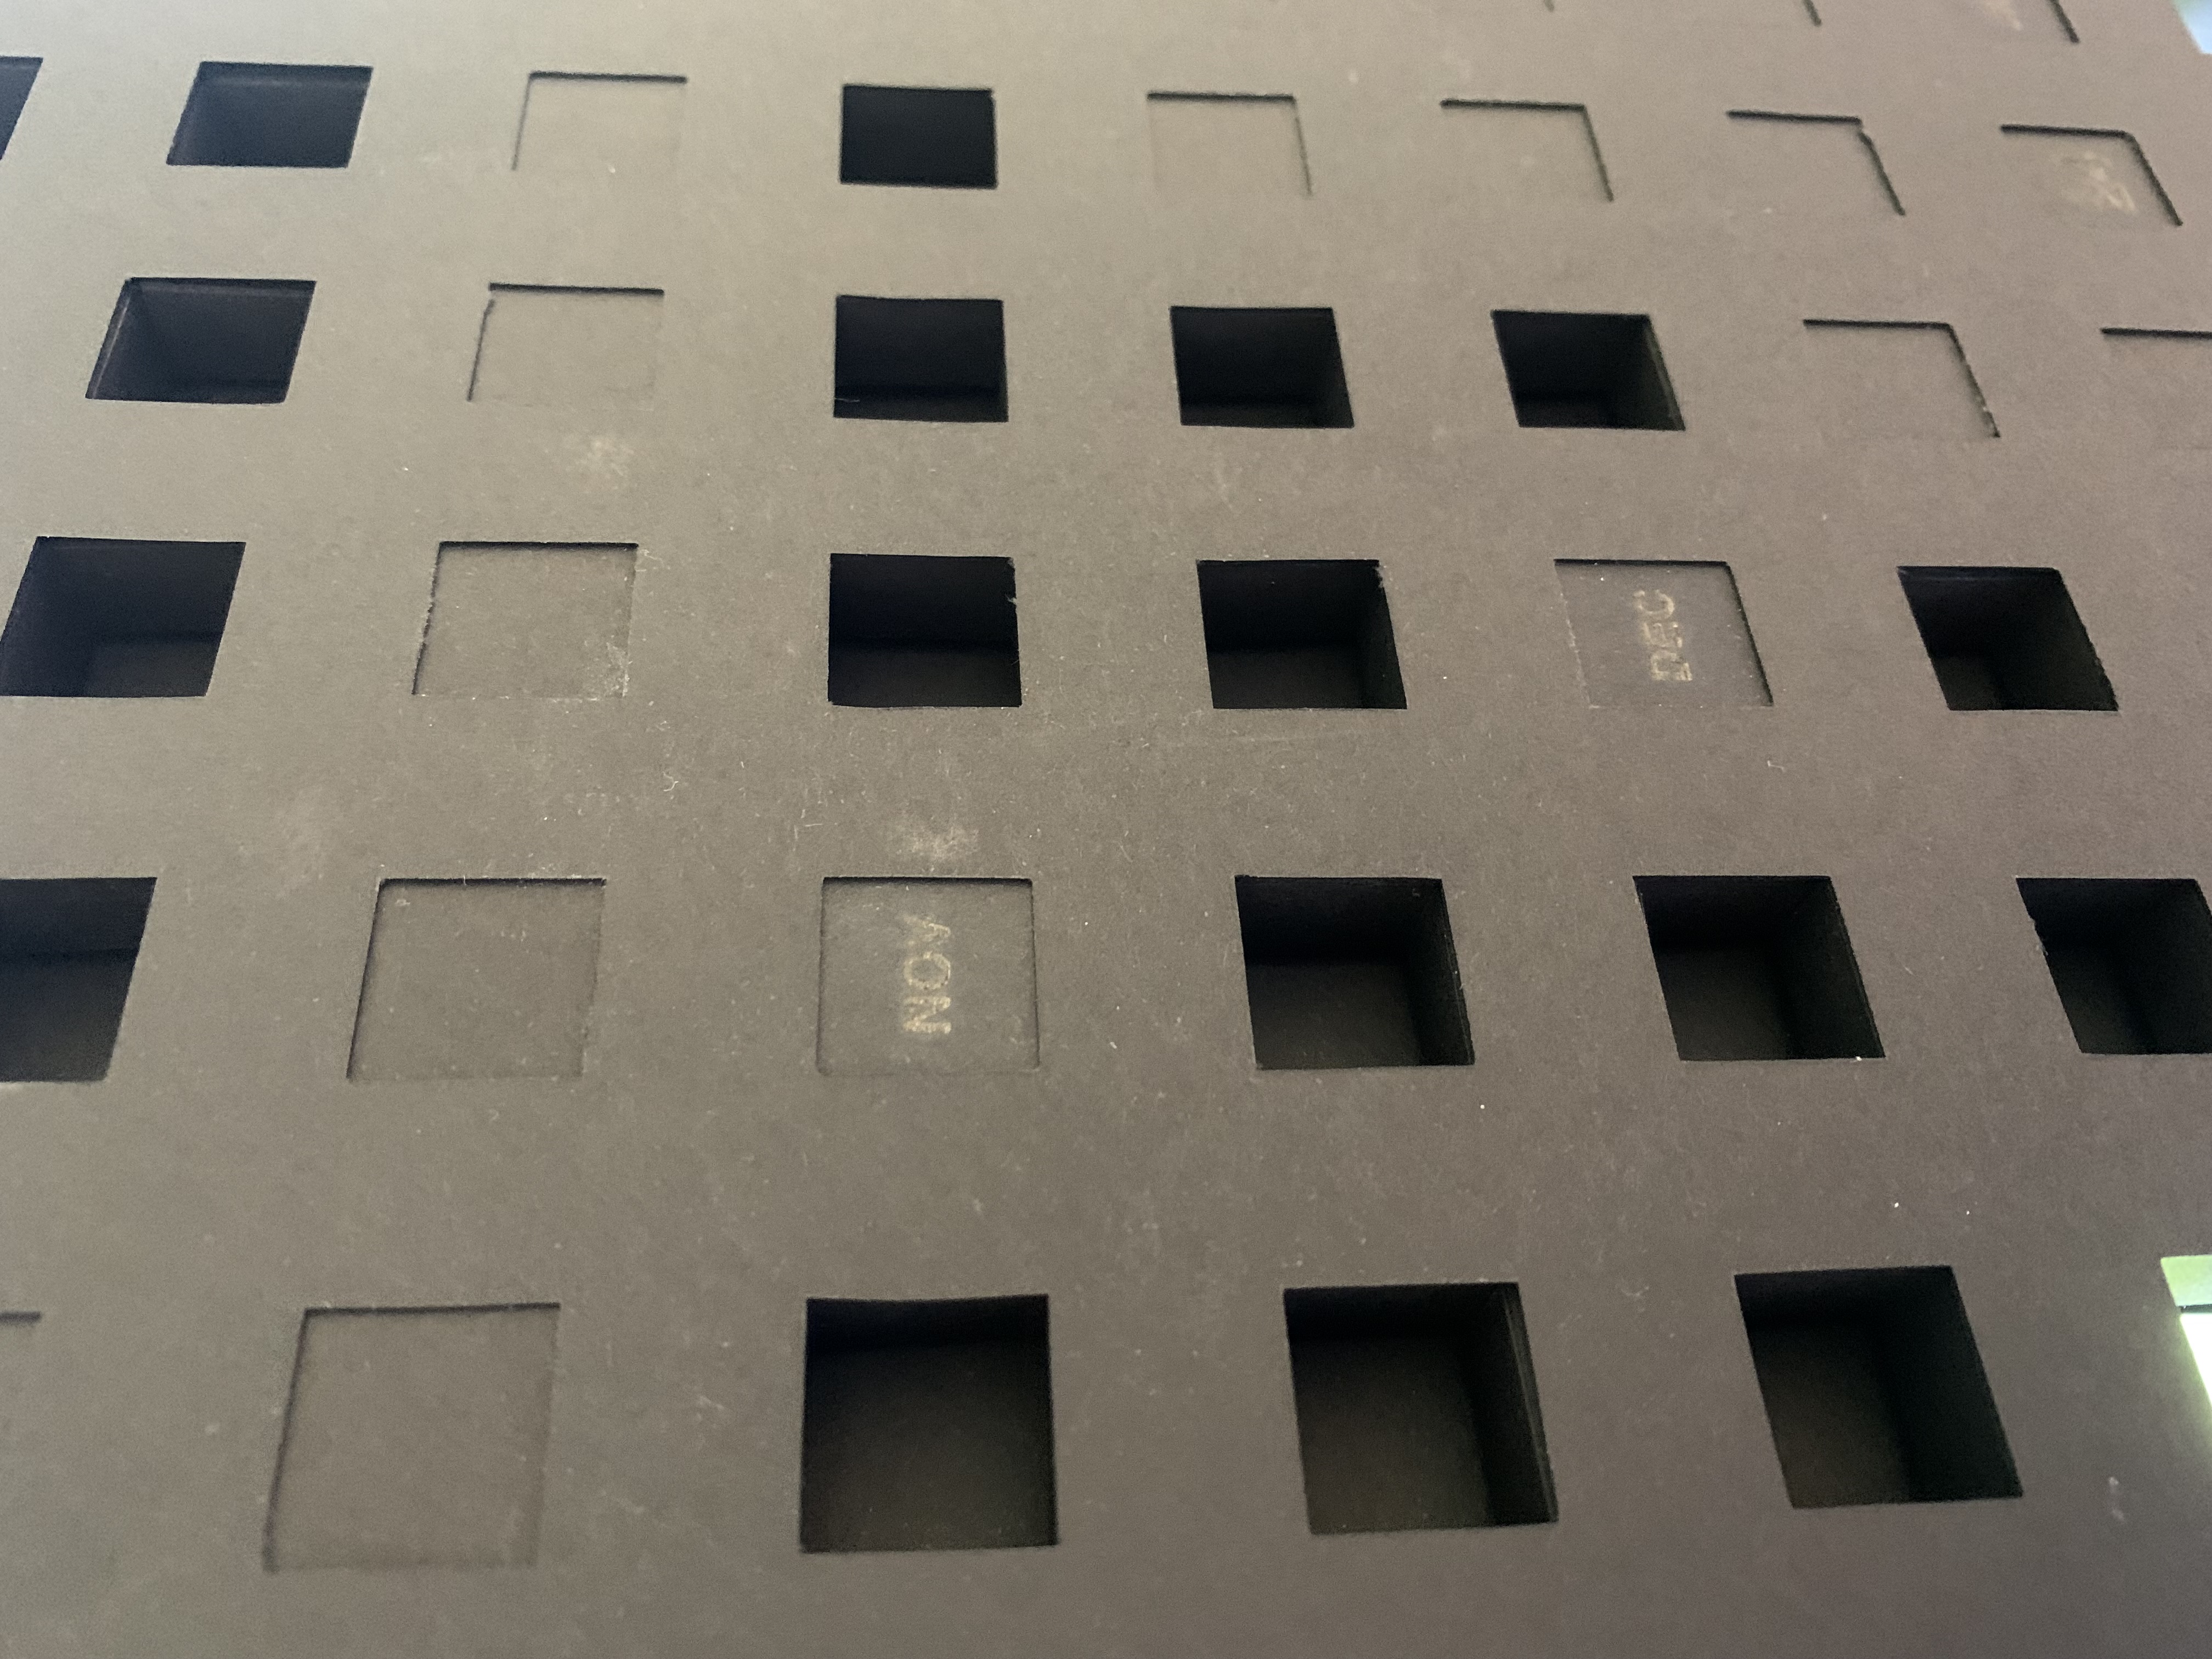
These show in different ways how large amounts of data can be visualised to make it easier to understand certain aspects of the data, that be the sheer amount, number of different markers and so on.